


Profitable scalping strategy with Heiken Ashi and Commodity Channel Index
Heiken Ashi and Commodity Channel Index (CCI) are very interesting and popular forex indicators. There are many trading strategies which are based on these two indicators. But in this article we will explain to you how to combine both of them to trade in forex with higher precision.
What is Heiken Ashi?
Heiken Ashi is a Japanese trading indicator that means "average pace". Heiken Ashi charts resemble candlestick charts, but have a smoother appearance as they track a range of price movements, rather than tracking every price movement as with candlesticks. These charts are used by traders and investors to help determine and predict price movements.
Heiken Ashi sometimes is called "Heikin Ashi" in different articles. But it is the same indicator.
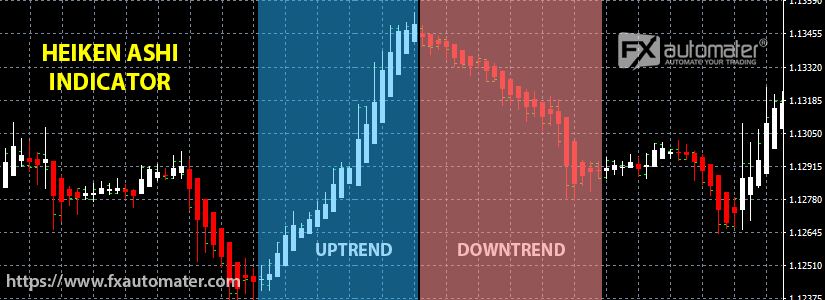
Added to the chart Heiken Ashi changes the main colors of the candles. In our case, the new colors are white and red.
White candles with no lower shadow signal a strong UPTREND.
Red candles with no upper shadow signal a strong DOWNTREND.
Switching from one color to another usually means changing the direction of the trend. Such changes are interpreted as BUY and SELL signals/opportunities. For example: switching from white candles to red candles means a SELL signal. Switching from red to white means a BUY signal. Of course, there are rules, but we will explain these rules in another article dedicated entirely to the Heiken Ashi indicator.
What is Commodity Channel Index (CCI)?
The Commodity Channel Index (CCI) is an oscillator used from traders and investors to identify price reversals, trend strength, overbought and oversold levels. The CCI is categorized as a momentum oscillator. As with most indicators, the CCI should be used in conjunction with other aspects of technical analysis.
In general, CCI measures the current price level relative to an average price level over a given period of time. CCI is relatively high when prices are far above their average, but is relatively low when prices are far below their average. In this manner, CCI can be used to identify overbought and oversold levels.
There are also divergences—when the price is moving in the opposite direction of the indicator. If the price is rising and the CCI is falling, this can indicate a weakness in the trend
Check the below image to see how CCI looks like on the chart:
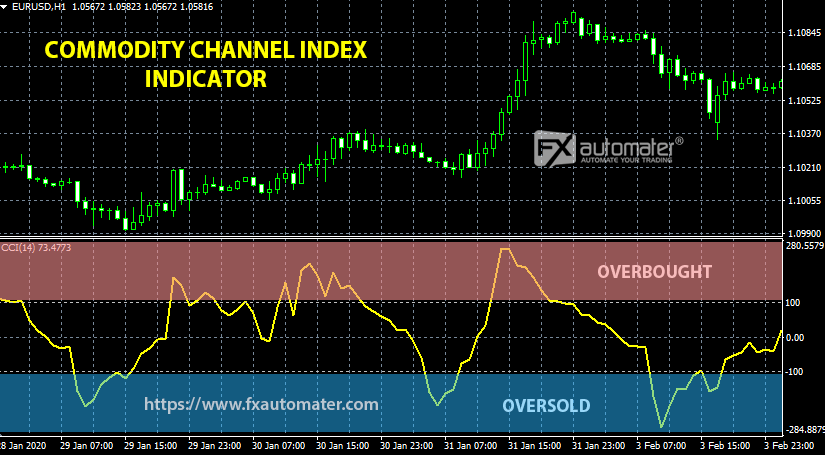
The CCI value moves above and below zero. There are two borders +100 and -100 which are very important. They are used for generating BUY and SELL signals. When the value of CCI exceeds +100, price is considered to be entering into a strong uptrend and a buy position can be opened. When the value of CCI falls below -100, price is considered to be in a strong downtrend and a sell position can be opened.
In our article, we will explain how to use CCI in combination with Heiken Ashi to confirm signals generated by Heiken Ashi. Continue reading to learn how to confirm Heiken Ashi signals.
How to combine Heiken Ashi and CCI for more precise trading signals?
Both forex indicators Heiken Ashi and CCI cannot boast of very accurate signals. But by combining both indicators signals we can get more accurate signals and trade with greater precision. Combining the two indicators, we also have the opportunity to close positions earlier and take the profit earlier before there is a turnaround in the market.
Instead of explaining both indicators separately, we will try to show you how to combine and use them as one single indicator.
How to open a BUY position with Heiken Ashi and CCI
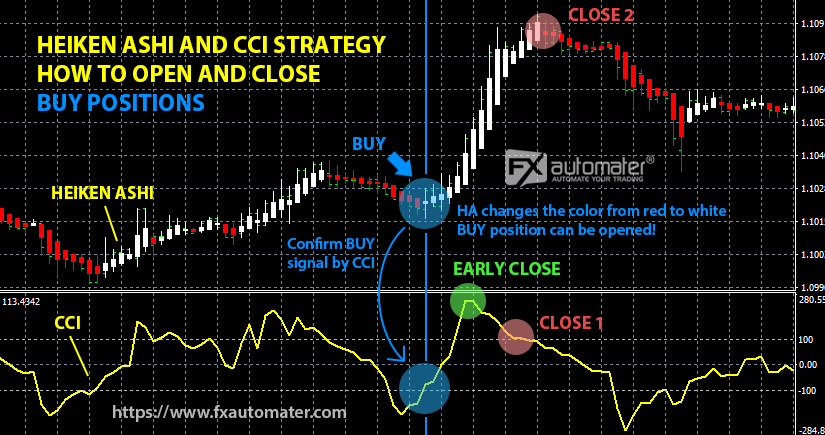
In the above picture you can see both forex indicators added to the chart. First we will explain when to open a BUY position.
The main indicator we will look at is Heiken Ashi. We will only use CCI to confirm the Heiken Ashi signals for precision trading. When Heiken Ashi changes its color from red to white it is interpreted as a BUY signal. But before opening a BUY position, we check the CCI indicator. If the CCI line crosses the border -100 from bottom to top, this is a confirmation and we can open a BUY position. It is possible that one of the indicators rushes or slows down, i.e. signals may not match. A difference within a few bars/candles is acceptable. It is good to wait and when we have visual confirmation from both indicators to open a BUY position. If there is no confirmation, we simply skip and do not open an order. We are waiting for another opportunity.
We explained how to open BUY positions by looking at Heiken Ashi and CCI. When to close BUY positions? We have 3 closing options:
- Early closing by CCI: Look at EARLY CLOSE in the above image. When the CCI value is above 100 and there is a reversal of the value ie. forming a triangle we can close the order early and take the profit.
- Close on CCI signal: Look at CLOSE 1 in the above image. When the CCI line crosses the border 100 from top to bottom, it is a signal to close the BUY positions.
- Close on Heiken Ashi signal: Look at CLOSE 2 in the above image. When the Heiken Ashi changes its color from white to red it is usually a SELL signal but also a signal to close the BUY positions.
How to open a SELL position with Heiken Ashi and CCI
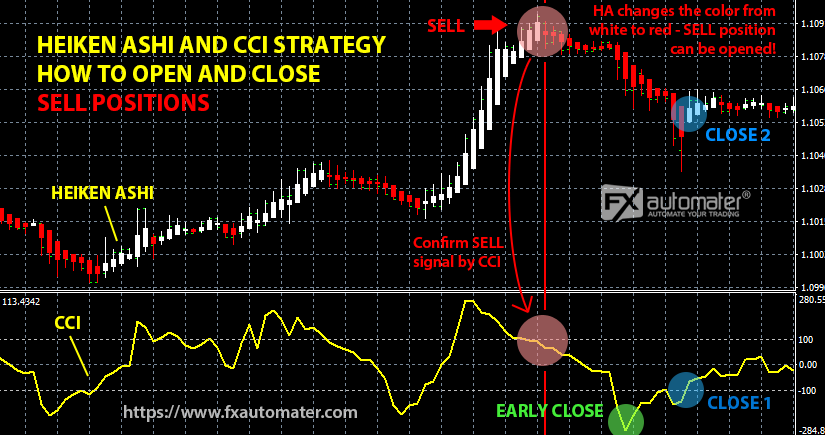
To open a SELL position, we follow the following logic: when the Heiken Ashi indicator changes its color from white to red, it is an indication that we can open a SELL position. But for greater precision, we again look at the CCI indicator for confirmation. If the CCI line crosses the border 100 from top to bottom it is taken as a confirmation and we can open a SELL position. Let's not forget that there may be a difference in the signals of both indicators. That's why we always open a SELL order upon visual confirmation from both indicators, regardless of which is the first to generate a signal and which is the last.
For SELL positions we also have three closing methods:
- Early closing by CCI: Look at EARLY CLOSE in the above image. When the CCI value is below -100 and there is a reversal of the value ie. forming a triangle we can close the order early and take the profit.
- Close on CCI signal: Look at CLOSE 1 in the above image. When the CCI line crosses the border -100 from bottom to top, it is a signal to close the SELL positions.
- Close on Heiken Ashi signal: Look at CLOSE 2 in the above image. When Heiken Ashi changes its color from red to white it is usually a BUY signal but also a signal to close SELL positions.
As we have seen above, trading with Heiken Ashi in combination with CCI is very easy and much more accurate compared to trading with only one of them. This is quite a winning strategy. Under good conditions, you can make good money.
"It is recommended to always set Stop Loss and Take Profit in the positions you open manually! This will guarantee you peace of mind and risk-free trading."
If you have any questions related to this article don't hesitate to comment below or to contact us.
Comment(s) (4)
July 13 2022, 9:11 AMHello Masaki, We are glad to hear that this strategy let you make some good profits. Indeed, this strategy is very good and the combination is unique. The best time frames are M15, M30 and H1. For example on M15 you will get BUY and SELL signals more often. On H1 you will get BUY and SELL signals less often but more accurate. Perhaps in the near future our team will develop a forex robot that trades following this successful strategy. Follow us regularly to stay informed about our new forex robots and strategies.
A very good and successful combination of two indicators. In 3 days I made about 150 dollars trading EURUSD and GBPUSD on M15 chart. Thank you for sharing this strategy with us. I hope in the future you can create an EA that trades with this logic. I think it will be quite profitable. By the way which is the best time frame to use this strategy on?
July 13 2022, 8:56 AMBrilliant - thank you!
July 07 2022, 2:21 PMHave placed a couple of winning trades already.
Nice and simple.
Very interesting. Will test it im the next time. Thank you for this information.
July 07 2022, 1:33 PM